

Automating Daily Oracle ASM Health Checks with a Shell Script
Monitoring Oracle ASM is an important part of maintaining a healthy Oracle database environment. Disk group capacity, disk status, rebalance operations, I/O distribution, voting files, and ASM compatibility settings can all affect database availability and performance.
Instead of manually running multiple SQL queries every day, I use a simple shell script to collect these checks automatically and generate a consolidated ASM health report.
The script also maintains an execution log and can email the completed report to the DBA team.
The complete script is available on GitHub:
GitHub: Oracle ASM Daily Health Check Script
This article explains what the script checks and how it can be used as part of routine Oracle ASM monitoring.
What the Script Does
The script connects locally to the Oracle ASM instance using:
sqlplus -s / as sysdbaIt then collects several important ASM health metrics and writes the results into a timestamped report file.
For example:
asm_daily_report_20261007_0900.txtA separate log file tracks execution status:
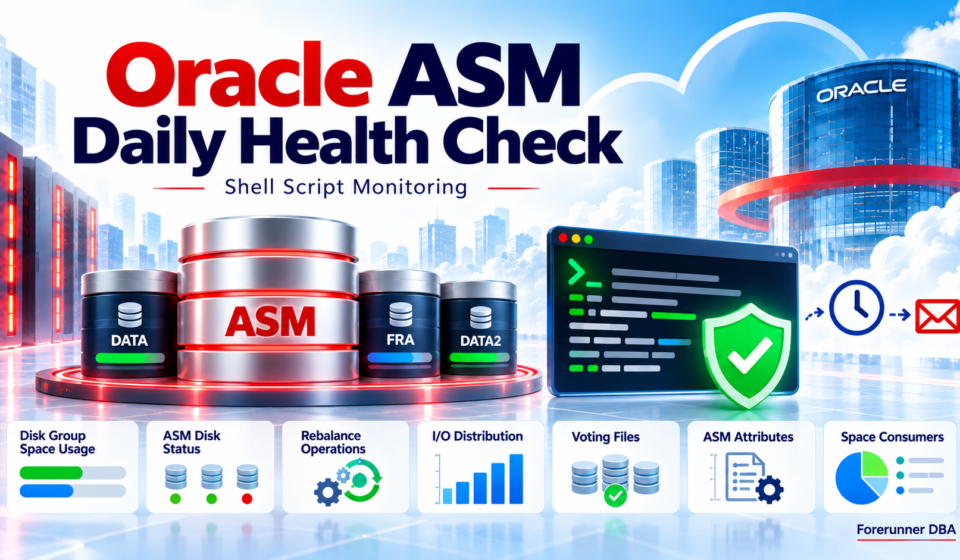
asm_health_check.logThe script currently performs seven ASM health checks:
- Disk group space usage
- ASM disk status
- Current ASM operations
- Disk I/O distribution
- Voting file locations
- ASM disk group attributes
- ASM space consumers
It also provides basic error handling and optional email notification.
1. ASM Disk Group Space Usage
The first check provides an overview of all mounted ASM disk groups.
The report includes:
Disk Group
State
Redundancy
Total Space
Free Space
Usable Space
Used Percentage
The information comes from:
V$ASM_DISKGROUPThis is one of the most useful checks for daily monitoring because it helps identify disk groups that are approaching capacity.
A typical output may look similar to:
NAME     STATE    REDUNDANCY  TOTAL_GB  FREE_GB  USABLE_GB  USED_PCT
-------- -------- ----------- --------- -------- ----------- --------
DATA     MOUNTED  EXTERN           500      120         120       76
FRA      MOUNTED  EXTERN           300       90          90       70
REDO     MOUNTED  EXTERN           100       70          70       30
A rapid increase in USED_PCT can indicate database growth, archived redo accumulation, backup retention issues, or another storage-related condition that needs investigation.
2. ASM Disk Status
The next check examines the individual disks that belong to the ASM disk groups.
The script queries:
V$ASM_DISKand reports information including:
Disk Group
Disk Number
Disk Name
Disk Path
Mount Status
Header Status
Disk State
Failgroup
Total Space
Free Space
This helps identify disks that may no longer be functioning normally.
For example, during normal operation you would generally expect disks belonging to a mounted disk group to show appropriate states such as:
MOUNT_STATUS = CACHED
HEADER_STATUS = MEMBER
STATE = NORMAL
Unexpected values should be reviewed because they may indicate disk discovery, membership, storage, or ASM configuration problems.
3. Current ASM Operations
ASM automatically redistributes data when storage changes occur.
For example, ASM may initiate a rebalance operation after:
Adding a disk
Dropping a disk
Resizing storage
Changing rebalance power
Storage maintenance
The script checks:
V$ASM_OPERATIONand reports:
Group Number
Operation
State
Power
Estimated Remaining Time
If no ASM operation is running, the query normally returns no rows.
When a rebalance is running, this section provides a quick way to determine whether the operation is still active and approximately how long it may take to complete.
4. ASM I/O Distribution
The script also checks how I/O activity is distributed across ASM disks.
For each disk, it collects:
Reads
Writes
Read Errors
Write Errors
Percentage of Disk Group I/O
This information comes from V$ASM_DISK.
The calculated I/O percentage makes it easier to compare disk activity within the same disk group.
For example:
DISKGROUP  DISK       READS      WRITES     READ_ERRS WRITE_ERRS IO_PCT
---------  ---------  ---------  ---------  --------- ---------- ------
DATA       DATA_0000  1823045    1354221    0         0          25.12
DATA       DATA_0001  1798443    1328411    0         0          24.78
DATA       DATA_0002  1819204    1341210    0         0          25.03
DATA       DATA_0003  1834901    1349105    0         0          25.07
The goal is not necessarily for every disk to have exactly identical statistics, but large differences or persistent read/write errors deserve further investigation.
5. Voting File Locations
For Grid Infrastructure environments, voting files are critical components of Oracle Clusterware.
The script identifies ASM disks containing voting files using:
V$ASM_DISKand the:
VOTING_FILE = 'Y'attribute.
The report displays the voting file disk name and path.
This provides a quick verification of where voting files are currently stored.
It can be particularly useful before or after:
ASM storage maintenance
Disk replacement
Grid Infrastructure upgrades
Storage migrations
Disk group changes
6. ASM Disk Group Attributes
ASM disk groups contain several attributes that influence compatibility and storage behaviour.
The script checks four useful attributes:
compatible.asm
compatible.rdbms
au_size
disk_repair_time
compatible.asm
Controls the minimum ASM software version that can access the disk group.
compatible.rdbms
Controls which Oracle Database versions can use the disk group.
au_size
Shows the Allocation Unit size configured for the ASM disk group.
For example:
1M
4M
disk_repair_time
Defines how long ASM waits before dropping extents belonging to an offline disk.
Collecting these values in the daily report provides a convenient reference when troubleshooting or planning upgrades and storage changes.
7. ASM Space Consumers
The final SQL check summarizes ASM space consumption based on ASM file type.
The script queries:
V$ASM_FILEand groups files by disk group and type.
Typical ASM file types may include:
DATAFILE
ONLINELOG
ARCHIVELOG
CONTROLFILE
TEMPFILE
BACKUPSET
PARAMETERFILE
The report shows:
Disk Group
ASM File Type
Number of Files
Total Size
For example:
DISKGROUP  TYPE          FILES   SIZE_GB
---------  ------------  ------  -------
DATA       DATAFILE        120    820.45
FRA        ARCHIVELOG      846     96.31
FRA        BACKUPSET        24    240.72
REDO       ONLINELOG        12     48.00
This gives a quick high-level view of what is consuming ASM storage.
Error Handling
The script includes a simple error-checking function.
If an important SQL command fails, the script:
Records the error in the log
Adds the error to the report
Attempts to send an error notification
Stops execution
This prevents the script from silently completing when one of the main health checks has failed.
The execution log contains timestamped messages such as:
[2026-10-07 09:00:01] Starting ASM Health Check
[2026-10-07 09:00:05] Health check completed successfully
This is useful when running the script automatically through cron.
Email Notification
The script can send the completed ASM health report using:
mailxIf the health check completes successfully, the generated report is included in the email.
If an error occurs, the script sends an error notification instead.
Before using this functionality, make sure mailx and the operating system mail configuration are correctly configured.
If mailx is not available, the script continues and records the following warning:
Warning: mailx not found. Email not sent.The health-check report itself is still generated.
Environment Configuration
Before running the script, update the environment-specific variables near the beginning of the script.
For example:
ORACLE_SID=+ASM1
ORACLE_HOME=/u01/app/19.3.0/grid
EMAIL_TO="your-email@example.com"
Modify these values according to your Grid Infrastructure environment.
For a RAC environment, the ASM SID may differ by node, for example:
+ASM1
+ASM2
+ASM3
The script should therefore be configured appropriately on the node where it runs.
Running the Script
Make the script executable:
chmod +x asm_daily_health_check.shRun it manually:
./asm_daily_health_check.shAfter execution, the script creates a timestamped report similar to:
asm_daily_report_20261007_0900.txtand updates:
asm_health_check.logAutomating the Health Check with Cron
Since this script is designed for routine monitoring, it can easily be scheduled through cron.
For example, to run the ASM health check every morning at 6:00 AM:
crontab -eAdd:
0 6 * * * /path/to/asm_daily_health_check.sh >> /path/to/asm_health_cron.log 2>&1Make sure the Oracle/Grid Infrastructure user executing the cron job has the required permissions and environment access.
Using absolute paths for scripts and log files is generally preferable when scheduling administrative scripts through cron.
Example Daily Workflow
A simple monitoring workflow could therefore look like:
Cron
  |
  v
ASM Health Check Script
  |
  +--> Check Disk Group Capacity
  |
  +--> Check ASM Disks
  |
  +--> Check Rebalance Operations
  |
  +--> Check I/O Distribution
  |
  +--> Check Voting Files
  |
  +--> Check ASM Attributes
  |
  +--> Check Space Consumers
  |
  v
Generate Report
  |
  +--> Write Execution Log
  |
  v
Email Report
Instead of logging into the server every morning and executing multiple queries manually, the DBA receives one consolidated ASM health report.
GitHub Source
The complete shell script, including all SQL queries, logging, error handling, and email notification logic, is available in my GitHub repository:
View asm_daily_health_check.sh on GitHub
Conclusion
This script provides a lightweight way to automate several common Oracle ASM health checks.
With a single execution, it provides visibility into:
ASM disk group capacity
Individual disk health
ASM rebalance activity
Disk I/O distribution
Voting file locations
ASM compatibility and storage attributes
ASM file-space consumption
Combined with logging, error handling, email notification, and cron scheduling, it can become a useful part of a DBA’s daily monitoring routine.
The script is intentionally simple and can be extended further with features such as capacity thresholds, alert-only notifications, ASM alert-log checks, Clusterware resource status, database status checks, and historical trend reporting.